Manuali VOIspeed®
Call analysis report
In this section it is possible to carry out an advanced analysis of the calls managed by the VOIspeed switchboard and, if desired, to schedule the periodic sending of the results by email. Through a series of filters it is possible to carry out complex processing on the switchboard database and to extract a great variety of information useful for analyzing the traffic of one’s telephone system and evaluating its efficiency and / or costs. The primary objective of the call analyzer is to provide aggregated data, that is, grouped on the basis of a common criterion, but it is also possible to show non-aggregated data.
At the entrance to the analysis section, a list of 4 predefined analysis models appears that you can reuse or modify with ![]() , delete with
, delete with ![]() , run with
, run with ![]() and finally download the results with
and finally download the results with ![]() . The templates cover both outgoing and incoming calls, respectively:
. The templates cover both outgoing and incoming calls, respectively:
|
|
Mobile calls Calls from customers Fixed calls User calls |
Calls made to mobile phones Calls received by the switchboard Calls made to landlines Calls made by individual users |
A model is an object that collects and stores the parameters defined in an analysis to be applied when desired (in fact it is the query defined by the parameters chosen by the user and which is performed on the switchboard database).
It is obviously possible to create customized analyzes for your needs.
Create a new analysis
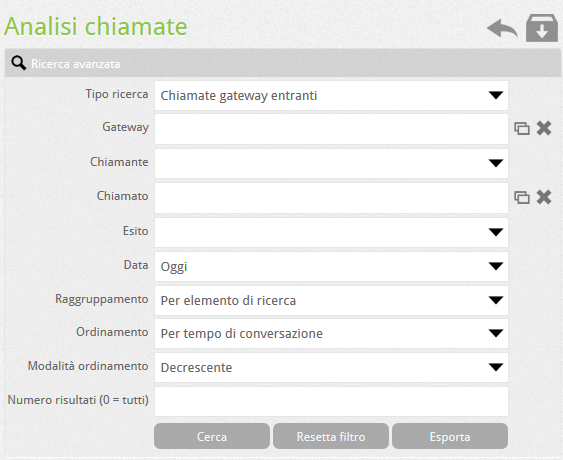
To create a new analysis click on the ![]() button. The advanced filter consists of the following fields:
button. The advanced filter consists of the following fields:
 |
| At the same time as the type of search selected, a field that can be used for the search is displayed (Gateway, User, Department, IVR, Group, Voicemail): in particular in the numeric search fields it is possible to use the% symbol as a wildcard character to indicate a series of numbers with the same root: for example to indicate “all numbers starting with 07338117 …”, you can write “07338117%”. Outcome: the final outcome of the call (OK, Busy, Reject, Unreachable, No answer, etc.) |
| Date: search date or time range |
| Direction: only for searches such as “User Calls” or “Department Calls”. It is also possible to indicate the direction of the call or whether it is internal. To perform these searches it takes more time because a cross-query on multiple tables is used to understand if the call is internal or not |
| Grouping: indicates what is the criterion for grouping the results (you can also choose not to group) and simplifies the display. In the case of non-grouping, the search takes longer because a cross-query on multiple tables is used to retrieve information on the number called / calling and the time of the call. |
| Sorting: choose by which search field to sort the results and the Sorting mode (ascending or descending). |
| Number of results: limits the number of results obtained from the search to the desired value (0 = all) |
Note: the “Incoming” and “Outgoing” fields indicate how many calls of that type there are for each row of aggregated data. If the data is not aggregated, that is, one row per call, these values can be 1 or 0, exclusively. Internal calls will have both values at 0. The totals reflect this behavior so on n lines shown with e incoming calls and u outgoing calls it could be e + u <n
Results Table
The results of the processing are shown in a table that shows the information based on the selected filter: the partial and total conversation times, the ringing times (in which the call was in the ringing phase) and waiting times (in the call was put on hold by the user); the type of grouping selected and other useful information
Export reports and models Call analysis
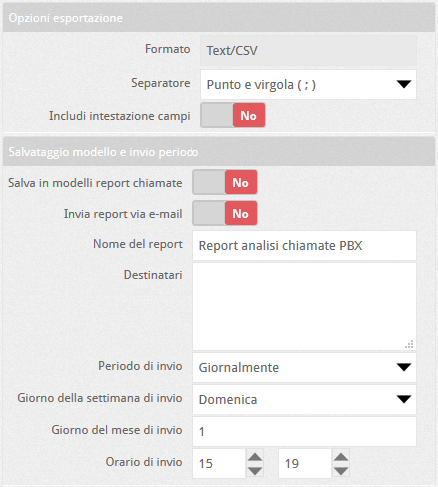
It is possible to export an analysis obtained with the choices: by clicking on ![]() fields will appear to complete the export and possibly schedule the periodic sending. Calls currently listed by the PBX will be exported, ie those filtered using the criteria set in the advanced filter. Finish the export by pressing OK.
fields will appear to complete the export and possibly schedule the periodic sending. Calls currently listed by the PBX will be exported, ie those filtered using the criteria set in the advanced filter. Finish the export by pressing OK.
The system will generate a file containing the call list with the relative details and will allow you to download it via a link. The following parameters can be set in the export window
Graphs
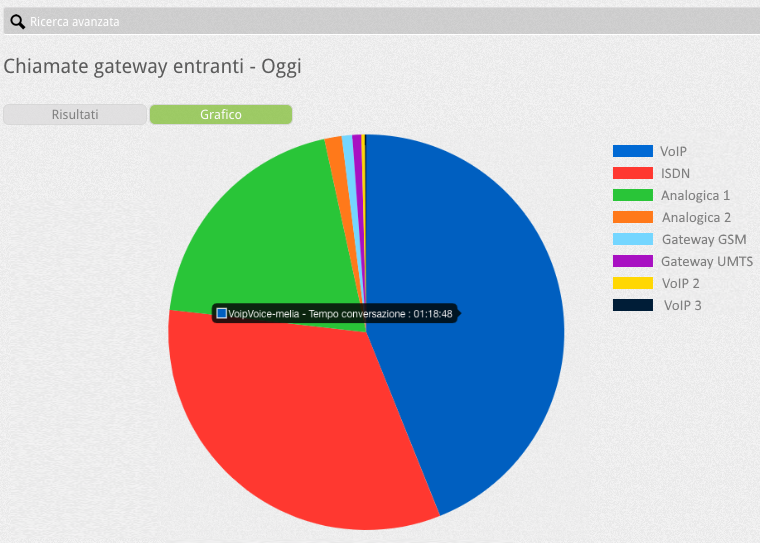
In addition to the table display of the information obtained following a specific called analysis, it is possible to obtain a graph of this information.
During the settings related to the analysis characteristics, seen at the beginning of the article, if the Grouping parameter is set to a value other than No grouping (which would produce a flat list of all the calls respecting the other constraints), it is possible to decide:
|
 |
| Once these settings have been completed, the graph can be displayed together with the tabular view of the data by using the appropriate selector on the results page and / or receiving it together with the .csv file when the search is saved for periodic export. |  |


