Manuali VOIspeed®
Monitor the active users on the VOIspeed switchboard
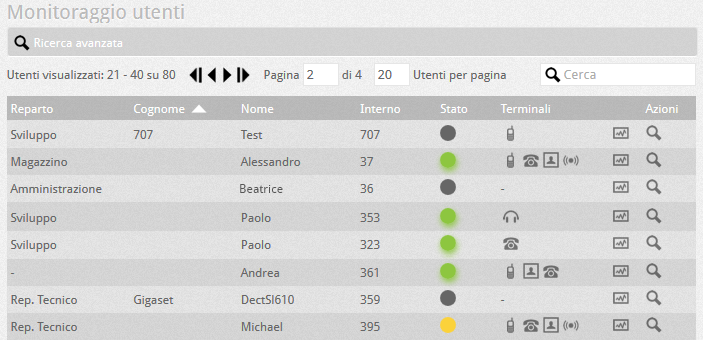
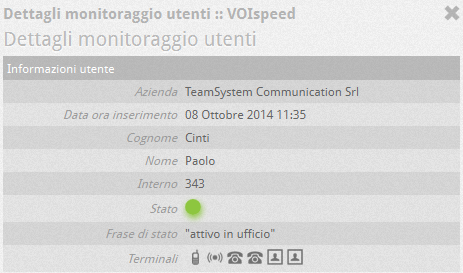
In the User Monitoring section you can find out the list of server users and their current status. It is also possible to know other information such as the department to which they belong, their personal data (name, surname, extension), their status, the terminals associated with them.
STATUS
The states are coded according to a colored dot:
- GREEN: free terminal
- GRAY: unauthenticated terminal on the PBX (disconnected or with incorrect credentials)
- RED: busy. The number of calls in progress is also indicated on the sticker
- ORANGE: ringing. The number of calls in progress is also indicated on the sticker
TERMINALS
The GUI can manage up to 4 terminals. The icons that can be displayed are explained below.
| User GUI active | |
| The user has also associated a mobile number with his personal data | |
| The user has a USB audio device | |
| The user has a SIP audio device (an IP phone, or an analog phone connected to a SIP adapter) | |
| The user has a DECT device |
By hovering the mouse over the icons representing the terminals, you will see further information (as also happens in the GUI). If the terminal is of the SIP type (IP phone, DECT, analog on SIP adapter), it will be possible to click on the icon to access the web interface of the device.
USERS DETAIL
It is possible to directly access the diagnostics (if activated) of the last two days of activity of the individual user by clicking directly on the diag button![]() associated with it. The information shown in the diagnostics will be congruent with the configurations of the package dump details in the Configuration -> System section accessible as super-admin.
associated with it. The information shown in the diagnostics will be congruent with the configurations of the package dump details in the Configuration -> System section accessible as super-admin.
The monitoring page is static by default. To activate the automatic update (every 2 seconds) click on the button![]() (initially gray) located at the top of the page
(initially gray) located at the top of the page
USER DIAGNOSTICS
It is possible to directly access the diagnostics (if activated) of the last two days of activity of the individual user by clicking directly on the diag button ![]() associated with it. The information shown in the diagnostics will be congruent with the configurations of the package dump details in the Configuration -> System section accessible as super-admin.
associated with it. The information shown in the diagnostics will be congruent with the configurations of the package dump details in the Configuration -> System section accessible as super-admin.
The monitoring page is static by default. To activate the automatic update (every 2 seconds) click on the button![]() (initially gray) located at the top of the page.
(initially gray) located at the top of the page.


